Best Retail Traffic Counters for In-Store Customer Journey
January 18, 2023
Unlock opportunity with customer counting
Make data-driven decisions to grow your library
Evaluate space utilization metrics
Communicate ride wait times and improve guest experience
Count, analyze, and control museum flow
Automate occupancy and guest count on your gaming floor
Monitor attendance at your church services
Limit access to paying members and track gym usage
Track road usage with car counter options
From the Retail Apocalypse to the worldwide pandemic, brick-and-mortar retail has experienced pressures in the past five years like never before in history, resulting in the highest rate of retail bankruptcies since the Great Recession.
But it’s not all doom-and-gloom; retail is not dead. The industry has undergone a supersonic transformation in how consumers shop. Some startups met those needs out of the gate, like implementing flexible shipping and pickup options, while existing brands, some with complex protocols or expensive overhead, are understandably taking longer to streamline operations. In some cases, loads of debt are holding back retailers from adapting and capitalizing on their full potential, leading to restructuring through Chapter 11 retail bankruptcies.
Bankruptcy has given many retailers a second chance – an opportunity to continue business, save thousands of jobs, purchase from suppliers and keep the economy moving.
Not only is Chapter 11 focused on restructuring the corporate-side of a retailer, it’s also focused on optimizing store operations to avoid falling into debt again. It’s a prime time to invest in technologies that assist in monitoring the health of stores and the overall business. People counting sensors are one such technology, accurately predicting future store traffic, making level performance comparisons between stores, and other metrics to aid in better business decisions.
Table of Contents
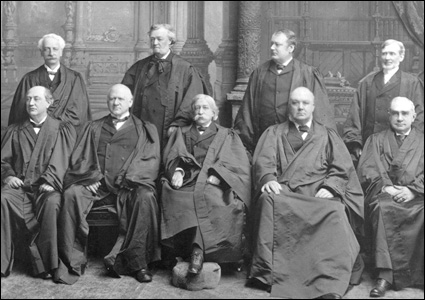
Following the Great Depression, a surge of businesses entered courts with loads of debt and no way to pay them. Longstanding brands and businesses with significant infrastructure and assets were looking to sell-off everything to pay back lenders. The American courts realized these businesses closing their doors had a detrimental impact on the economy – buildings became vacant, employees were out of work, and suppliers lost major clients.
To combat such negative economic impact, the courts created additional bankruptcy legislation to the Bankruptcy Act of 1898 – the Bankruptcy Acts of 1933 and 1934 – stating the goal of bankruptcy laws was to offer debtors a “fresh start” from financial burdens.
In Local Loan v Hunt, the Supreme Court asserts, “[I]t gives to the honest but unfortunate debtor…a new opportunity in life and a clear field for future effort, unhampered by the pressure and discouragement of preexisting debt.”
In 1978, existing bankruptcy Chapters were reorganized to make it easier for both businesses and individuals to file a bankruptcy and reorganize, resulting in the Chapter 11 filing we know today.
First, in Chapter 11 retail bankruptcies, the business would have to prove its revenue potential of remaining open is greater than its liquidation value. If ceasing operations and liquidating assets is more valuable than revenue potential, then the court will not permit a Chapter 11 filing.
According to the United States Courts, “This chapter of the Bankruptcy Code generally provides for reorganization, usually involving a corporation or partnership. A chapter 11 debtor usually proposes a plan of reorganization to keep its business alive and pay creditors over time.”
The next step is to restructure the ailing business where the creditors to whom money is owed now become the shareholders as an exchange of equity for debt. The restructuring process can look very different from one company to the next. The business’ management team can choose how to sell off assets, like storefronts, inventory, and intellectual property. Or the management team may choose a liquidation firm to assess and make such decisions. In other cases, the management team is overturn and the business relaunches under new management.
With such varying retail bankruptcy restructuring paths, ongoing business operations vary as well. In some instances, from an outsider’s perspective, the operations of the business appear unchanged during restructuring. Certain locations may close, but remaining locations look and feel the same as always. Behind the scenes, restructuring efforts are aimed at reviving profits, streamlining operations and paying off debts.
In other instances, a brand relaunch may take place where one liquidator company purchases the brand and another the supply chain and another the physical locations. While the brand name remains, it looks different than before. For example, in 2013 Authentic Brands Group purchased Juicy Couture and closed all of its U.S. stores. In the New York Times article, “The Two Men Buying Your Favorite Retailers”, Jamie Salter, founder and chief government of the Authentic Brands Group describes his thoughts on the acquisition of Juicy Couture without the stores, “I can tell you unequivocally it’s easier to build brands with a retail footprint — touch, feel, try on.”
At the end of the day, the goal of Chapter 11 bankruptcy is to shed debt while remaining open.
Over time, bankruptcy laws have been amended to meet ever-evolving corporate structures and the unfortunate prevalence of bankruptcy mills abusing the system for a payout.
While several factors play into the increase in retail bankruptcies in the last five years, the largest factors are changing consumer tastes and the shift to e-commerce, followed by the worldwide COVID-19 pandemic.
Often dubbed the “Retail Apocalypse” or the “Amazon Effect,” these recent years have seen a slew of brick-and-mortar store closures. Many retailers failed to adapt to the changes in how consumers shop and what they buy, while carrying the overhead of stocking, staffing and operating a large chain of physical stores.
According to Reuters’, notable retail bankruptcies include Toys R Us in 2017, resulting in liquidation and a huge blow to toy manufacturers, including Barbie maker Mattel Inc and rival Hasbro Inc.
“While the Toys R Us drama played out years ago, it remains relevant. To some extent, it, along with other cases, may have altered the relationship between retailers in Chapter 11 and the suppliers they depend on. At the very least, many vendors are more wary than they were before the toy retailer’s bankruptcy.” Retail Dive 1/20/22
In 2018, the longstanding U.S. retailer Sears Holdings Group filed for bankruptcy, serving as a symbol to the decline of shopping malls.
Retailers already strained from the retail apocalypse were handed the one-two punch as the COVID-19 pandemic swept across the globe. For months, consumers were ordered to stay home and businesses labeled non-essential, such as apparel retailers and their suppliers, had to cease operations.
Throughout 2020, 52 retailers, including 30 major retailers, filed for bankruptcy, among them were J. Crew, J.C. Penny, Brooks Brothers and Guitar Center resulting in 8,741 store closures.
2021 saw a 60% drop in retail bankruptcies compared to 2020 with 21 retailers filing, including L’Occitane and Belk. 2022 saw another drop as 10 retailers filed for bankruptcy, including Revlon and Sears Hometown.
On the flip side, the past five years have been successful for discount retailers such as Walmart, Target and Dollar General.
The pandemic also pushed retailers in all sectors to implement technologies, revamp inventory systems, repurpose stores into fulfilment centers, update e-commerce sites, and rollout delivery services in record time to adapt to stay-at-home orders. Many of these investments will pave the way for the success (and future existence) of some retail brands.
COVID-19 impacted nearly everyone in 2020, and retail businesses and their customers were no exception.
The pandemic not only changed the way retailers operate; it also changed the way consumers obtain goods. While some shifts in consumer behavior were temporary, others are likely to stay such as expecting flexible purchasing and return options, same-day delivery services and more personalized shopping experiences.
Historically, consumer behaviors were predictive and busy days, times and seasons were routine. When the pandemic enforced occupancy restrictions and a heightened desire to avoid crowds, consumers began shopping outside of those predicted busy times.
Moving forward, those old standards no longer exist, requiring retailers to collect new data to account for consumers’ new shopping patterns.
Bankruptcy is a time for retailers to take a hard look in the mirror. Time and money are spent assessing operations, management, supply chains, and every other component of running the businesses to uncover inefficiencies and make changes. Analyzing existing operations is only half of the assessment – it’s also vital to remain in constant assessment of new operations. The restructured retailer needs to be treated as a fresh start, not business-as-usual, to avoid falling into the same debt-cycle trap that led to bankruptcy in the first place.
Part of the fresh start is investing in software and systems that will ensure success. Technologies advance rapidly and restructuring is a perfect time to review existing contracts and shop around for improved systems or cost-savings. Look for systems that will replace manual tasks with automation, streamline operations, or offer reliable forecasting metrics.
Data alone is meaningless without context and insights. Look for software platforms that capture data and relay it in an insightful and actionable manner.
Better yet, merge data points from complimentary sources for a big-picture analysis, such as point of sale, staffing and traffic data. When the silos are removed, relationships are revealed and more efficient decisions can be made.
While it seems counterintuitive to spend money during bankruptcy, investing in data capturing systems is essential to staying in business for the long-run. How will you know the potential of remaining locations without knowing store traffic? How can you determine quantity of staff to hire or let go without combined staffing, conversion, and POS metrics? Data points like this help to strategically downsize a store’s footprint, set realistic goals, and make cost-saving changes.

Footfall is measured using people counting sensors and software to automatically count and record how many people enter a store.
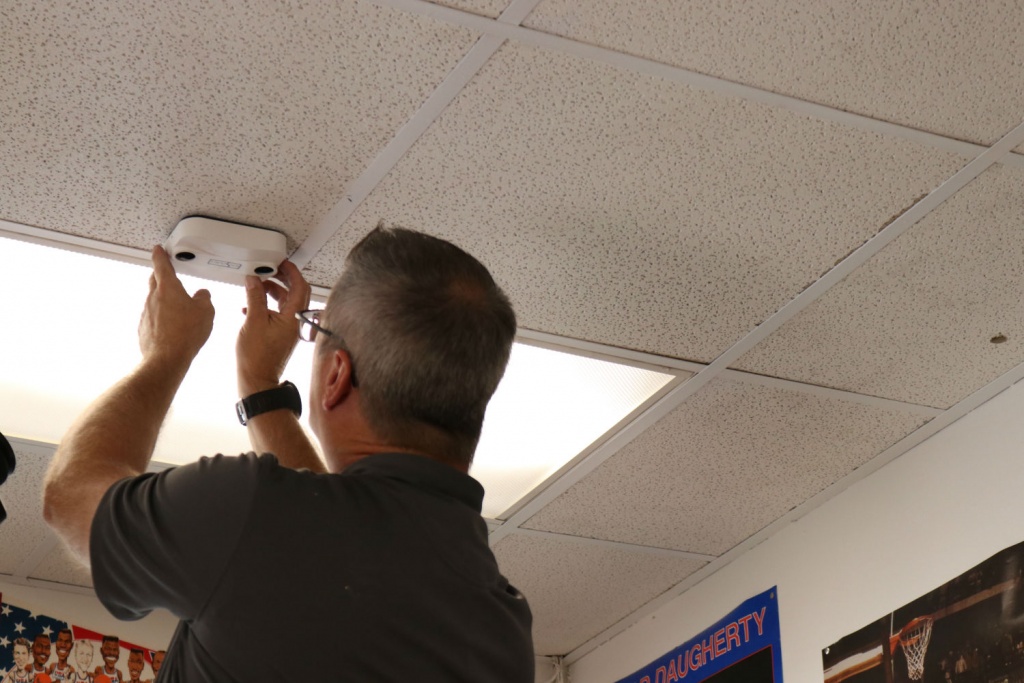
The most common and accurate technologies are video-based or thermal-based and both are installed on the ceiling over an entryway. Video counters use a single lens (monocular) or double lens (3D) to view people walking underneath. The processor is equipped with complex calculations, often times layered with AI, to detect and count humans, as opposed to non-human elements like shopping carts and boxes. Thermal-based counters use an infrared eye to identify the heat signature of people walking through its detection area. Less common technologies include break-beam style counters and those using time-of-flight or active infrared.
The footfall counting system is connected to the store’s network, via a cable (in most cases) or a Wi-Fi connection. The connection allows the sensor to talk to a cloud-based software platform. Features can vary between different types of software, but they generally include time-stamped or time-bins of count activity for visitor entrances and exits as well as historical reporting tools. It may also be able to connect to other data sources, such as point of sale or staffing.
More advanced analytics tools may include traffic forecasting, average visitor duration, conversion metrics, and recommended staff levels.
Retailers with substantial businesses operations software may opt to use the people counting software’s API to pull traffic data into their existing platform for reporting and analysis.
Analyzing sales data will tell you what sold in a day, but doesn’t give a complete picture of a store’s performance. Combining sales and labor with store traffic data answers the question, “how effective is my store at capitalizing on the opportunities presented?”

Retail sales are boiled down to two variables – the number of transactions and the average sale price.
Sales = # Transactions x $ Average Sale
Using this equation, the only two ways for a retailer to increase sales is to increase the number of transactions processed or increase the average dollar amount per sale. This is the basis for tactics such as up-selling, adding-on items, and marketing promotions.
However, sales alone don’t tell the whole story of a store’s performance. To measure whether a store is meeting its potential, you must take into account its sales opportunity.
For example, on a given day Store 1 brought in $5,000 sales while Store 2 rang in $4,000 sales. With the given data, Store 1 looks to be the more successful of the two.
Consider 500 people entered Store 1, whereas only 250 people entered Store 2. The store with the higher sales also received double the traffic. As store traffic is a measure of sales opportunity, Store 2 was more effective at capitalizing on the 250 opportunities entering the store in comparison to Store 1.
Adding traffic data to the sales equation presents a more realistic analysis of store performance and a more accurate prediction of sales volume. Rather than predicting sales by the number of transactions, use a conversion ratio to account for the number of people entering your store who will make a purchase.
Sales = Traffic x Conversion Ratio x $ Average Sales
Using the revised Sales Equation, you can increase sales by realizing and capitalizing on potential customers already in your store.

With e-commerce, it’s easy to understand your lost opportunities by examining abandoned shopping carts. As we try to merge the gap between virtual and physical data points, it’s also vital to examine in-store lost opportunities. And the only way to capture this metric is by knowing how many people enter your store.
People counting systems include a software component or API to view your traffic data. A simple, yet profound table to create is an hourly or daily view of lost opportunities by subtracting transactions from store traffic.
Lost Opportunities = Traffic – Transactions
To further refine this report, use a “group count” setting on your counting sensor. This setting detects and counts buying groups instead of individuals based on proximity and movement patterns. As families and couples often account for a single transaction, this setting makes for a more realistic measure of lost opportunities.
Finding the balance of streamlining operations to cut costs while maximizing profits is the recipe for success for any retailer, especially one emerging from bankruptcy. This is another area where basing decisions on POS data alone misses the mark.
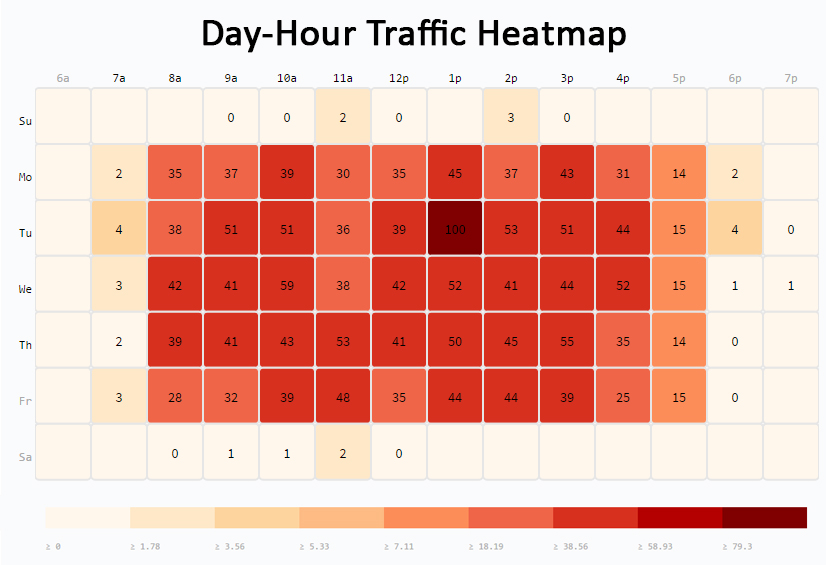
Quantifying customers throughout the day allows a retailer to see highest-trafficked times such as hours in a day, days of the week, months of the year, and so on. Once these “power hours” of predictable peak traffic are identified, you can focus on maximizing profits by capitalizing on opportunities already present in your store. You can also streamline operations by removing distractions and lower priority tasks from power hours, such as stocking shelves, breaking down shipments, scheduled maintenance, and employee breaks to take an “all hands on-deck” approach to serving customers.
Again, relying solely on sales data to make such decisions can be misleading. If a store has a less than desirable conversion rate, traffic volume may be high, but a negligent sales staff or other factors may have prevented potential customer from making a purchase.
More advanced people counting software will include highly accurate, predictive store traffic modules that take into account historical data along with holidays, seasons, and rate of change.
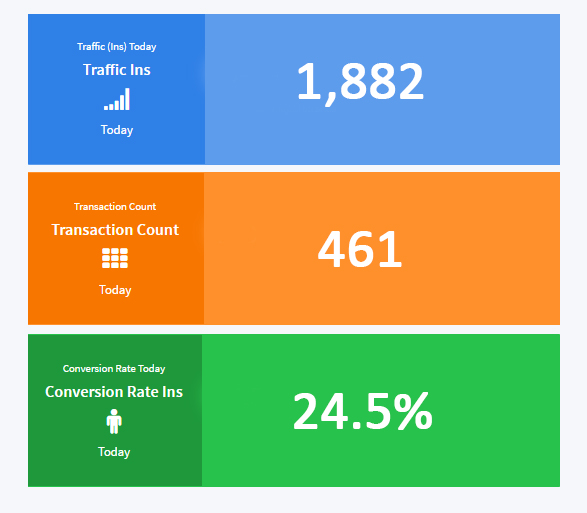
Aside from general traffic studies, the most common reason retailers invest in people counting systems is to determine conversion rate. The equation calculates the rate at which potential customers turn into purchasing customers. It also creates an apples-to-apples comparison of store performance across a brand.
Conversion rate = # transactions / # traffic
For example, 500 people entered a store today and 75 of them made a purchase. The day’s conversion rate is 15%, in other words, for every 100 potential customers entering the store, about 15 became customers. Analyzing each day’s conversion rate, you can determine which days offer additional sales growth opportunity.
When reviving a bankrupt retail chain, executives are continually evaluating the performance of remaining stores. Monitoring conversion rate will assist in the complex decision of choosing to close additional stores.
If a store continually misses sales goals, it’s likely to be on the black list. However, if the store’s conversion rate is low, further digging should be done to see why shoppers aren’t converting into customers. The low conversion rate proves the store has greater opportunity and small changes may be all it takes to revive the ailing store. On the other hand, if sales are low and the conversion rate is on par with successful stores, it reveals the store is capitalizing on the incoming traffic and still falling short.

Labor is a costly part of running a store. Emerging from bankruptcy is a time to scrutinize how money is spent, including how stores are staffed, while also considering how to maximize profits. Your store traffic data will uncover that intersection – the sweet spot of how many labor hours are needed to reach an ideal conversion rate and profitability.
A simple calculation to start with is Service Intensity.
Service Intensity = Traffic / Staff Hours
The Service Intensity rate reveals how many customers each employee is responsible for assisting. Each retail brand will have their own ideal ratio depending on the level of customer service required to make a purchase. For example, a shoe store where product must be retrieved from a stock room will require a higher customer-per-staff level than a clothing retailer where all inventory is on the sales floor. Complex sales like electronics or luxury retailers with high customer service expectations will also want a high service intensity rate.
Analyze your store’s top performing hours then locate that hour’s traffic and how many sales staff were present to begin finding your ideal service intensity.
While some of us love number-crunching, others just want the information they seek at the moment it’s needed. Thankfully for the latter group, some platforms (such as SenSource’s Vea) come equipped with a complex calculation to prescribe ideal staff levels. It can also analyze historical traffic trends to make accurate future traffic predictions. The predicted traffic levels are taken into account in the prescriptive staffing model, along with the average employee hourly wage, average sale dollar, and conversion rate. The data is then calculated into a chart to find the ideal staff level where conversions are optimized while remaining profitable.

High-level executive team members want data that showcases how stores are meeting the new corporate restructuring strategy. Common reports will feature historical and actual foot traffic and conversion metrics for each store in the chain.
In some instances, retailers enter bankruptcy because their brand has fallen out of favor with shoppers. Perhaps the brand image no longer resonates with its target demographic. Restructuring may bring new marketing talent onboard to revive the brand. Tracking performance of new marketing campaigns can gauge the brand’s new direction – what’s driving traffic and ultimately driving sales.
Marketing effectiveness can be measured by comparing pre and post campaign traffic. This is another instance where sales data doesn’t paint a full picture of performance. A campaign could drive traffic to a store, but sales don’t spike because the featured item is out of stock, poor customer service, too long of a line at checkout, etc.
With multiple stores under their watch, regional store managers need actionable reports that make their jobs more efficient and organized. Traffic and conversion reports that prioritize store performance make it easy to identify under-performing locations and plan visits. Conversion rate is a popular metric for regional store managers as it creates an apples-to-apples performance comparison – whether a location is in a busy tourist shopping center or in a suburban strip mall.
Running the day-to-day operations of a store, managers like to start their day with quick takeaways of historical stats, goals and future predictions. For example, a store manager’s dashboard may include yesterday’s total store traffic, week to week comparisons, today’s predicted traffic, goal conversion rate, and recommended staff hours for the day.
In many cases, during and after a retail bankruptcy filing, the retailer wants its stores to appear “business as usual” in the eyes of its customers, even though changes are happening behind the scenes with transition of executive personnel, closing of stores, and changing suppliers. Giving managers access to their store’s footfall data will empower them to track and reach goals and give definitive answers to the store’s overall performance.
During Chapter 11 bankruptcy, retailers must review every supplier contract for existing services. It’s the perfect time to shed unnecessary services and shop around for better pricing and features.
Often times a retailer will be locked into an existing over-priced people counting contract and need to seek out a new supplier to save money and receive more accurate data.
A people counting system is comprised of a hardware component – the sensor – and a software component. The sensor is usually proprietary to the supplier and will need replaced. This can be completed in a phased approach or a roll-out to all stores. Whenever possible, the new supplier will utilize existing cables to minimize installation time and cost.
The foot traffic data will be communicated to the new software system. Historical data can be imported to the new system for minimal disturbance to reports and calculations.
At the end of the day, retail bankruptcies must prove that remaining in business has potential to be more valuable than the income of selling-off assets and intellectual property. This means radical changes to business operations. In order to achieve success, executives need a plan in place to proactively monitor the health of remaining stores.
Collecting store traffic data across a retail chain provides the foundation for cost-saving analysis such as optimizing staff schedules, adjusting store hours to coincide with traffic flow, and identify ailing stores before they become unprofitable stores.
In addition to cost-savings, store traffic data is used to increase profits. Properly staffed stores will improve customer experience, ensure shelves are stocked and stores are clean and organized – all leading to increased customer satisfaction, return visits, and higher sales.
It takes a lot of time, gumption and allegiance to see your company through a Chapter 11 filing, to know the value of your brand, assets and employees and want to see them succeed again. In many cases, bankruptcy offers a retailer a second chance, to shed the burden of high debts through restructuring, and reinvent itself to prevail. It lends to the notion that one stumble shouldn’t mean that a retailer must shut down forever. Under that threat of failure, what reasonable person would start a business in the first place?