Top 5 Metrics Revealed by Implementing a Door Traffic Counter for Retail
Brick-and-mortar stores are always researching the latest and greatest technologies that can help set them apart from competitors and help measure performance.
A door traffic counter for retail isn’t necessarily the latest – it’s been around for decades – but advancements in data analysis have opened new doors for ways foot traffic data can be used by retailers.
This is part one of a three-part series where we’ll start with traditional threshold counting and work our way into the store for advanced interior metrics. In part-one, we’ll take a look at the different performance metrics retailers can access by simply having a people counting sensor installed at an entrance.

At SenSource, we’ve partnered with some of the leading retail chains in the US to implement our customer counting solutions in their stores. Over our 20 year history, we have identified three tiers of Retail Store Analytics, and which tier is the best fit for you will all depend on what information you are trying to collect.
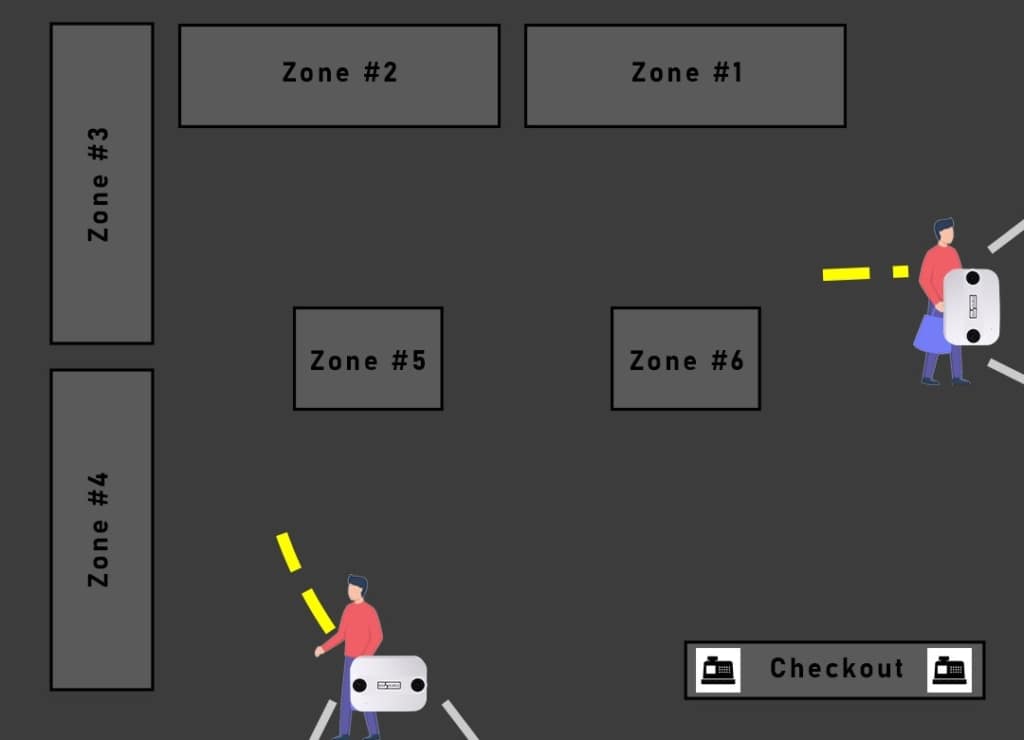
Tier 1 Threshold Counting is the most traditional counting application we offer. This is where we mount our sensors overhead at all of the entrances, or thresholds, of a given store. A door traffic counter for retail provides very accurate foot traffic counts to allow management teams to make critical decisions.

As you can see in the above mockup, we have sensors installed at both doors and we capture the customers entering and exiting. This does not allow for any visibility of the customer’s behavior once they are inside the store, but Tier 1 still unlocks powerful metrics, so let’s highlight a few of them:
- Traffic
The number of people who enter a store at a given time - Occupancy
The measure of how many people are in a store at a given time - Conversion Rate
The number of people who enter divided by the number of transactions - Average Visit Duration
How long the average shopper spends in the store - Hourly Traffic Forecasts
Highly accurate traffic forecasts
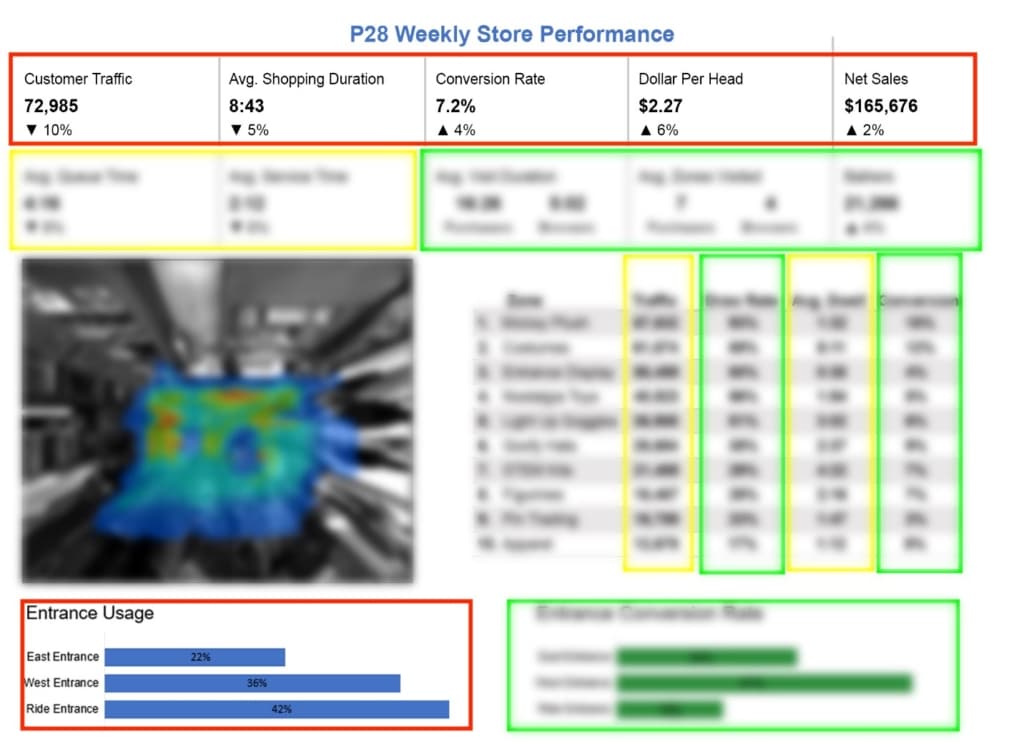
Over the next two videos, we’ll be discussing Tiers 2 and 3 which unlocks some visibility beyond the threshold. To give you an idea of what info could be coming, let’s take a look at a sample Store Performance scorecard.

As you can see above, in Tier 1 you have some incredible data available with customer traffic, shopping duration, conversion rate, and more.
However, as you look below there is data blurred out. In Tiers 2 & 3 we’ll reveal these metrics as we discuss in-depth insights on customer behavior – stay tuned!
Learn more about Customer Counting Solutions.

