Is it time to automate your tally counter?
April 6, 2020
Unlock opportunity with customer counting
Make data-driven decisions to grow your library
Evaluate space utilization metrics
Communicate ride wait times and improve guest experience
Count, analyze, and control museum flow
Automate occupancy and guest count on your gaming floor
Monitor attendance at your church services
Limit access to paying members and track gym usage
Track road usage with car counter options
People counting sensors are obviously used to count people and automate the process of collecting and analyzing that data. It sounds simple, but once you put it in a real-life scenario, you realize the many oddities to consider to ensure the most accurate data is collected.
Your employees keep walking under the sensor beefing up the numbers, now instead of the data showing 15 customers it looks like 30 people entered your store! What about counting at your rec center’s outdoor swimming pool where the hardware is to be mounted 30 feet in the air? Or maybe you want to quantify interactions inside your building rather than count how many people came through the front door. Let’s take a closer look at 5 unexpected sensor features and how each overcomes common obstacles.
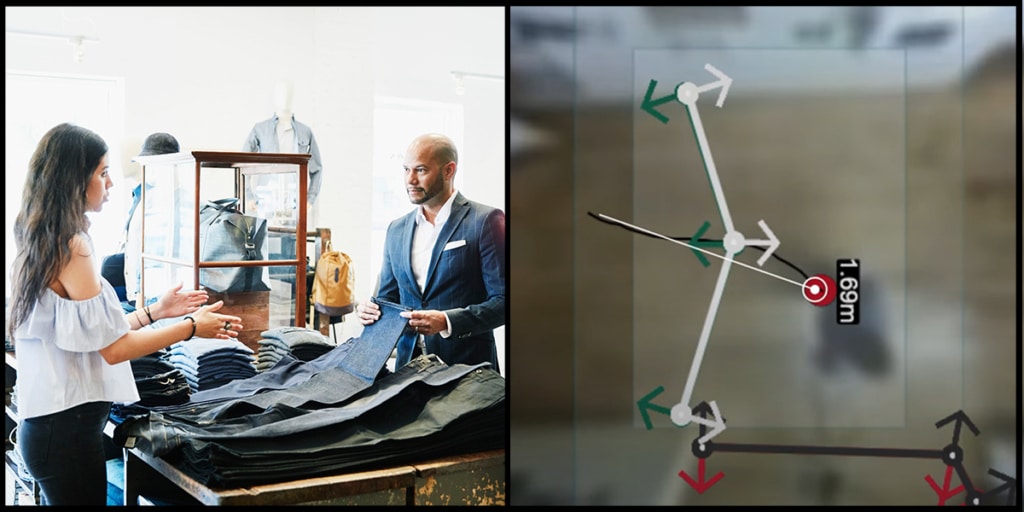
Your conversion calculation is only as accurate as your data. For a truer traffic count, utilize the employee exclusion feature. When wearing the special employee exclusion tag or lanyard, the system detects its presence and excludes the employee’s tracks from the dataset. This allows employees the freedom to stand at the entrance and greet customers, stock shelves, receive orders, or any other activities surrounding the entrance without inflating the customer count.
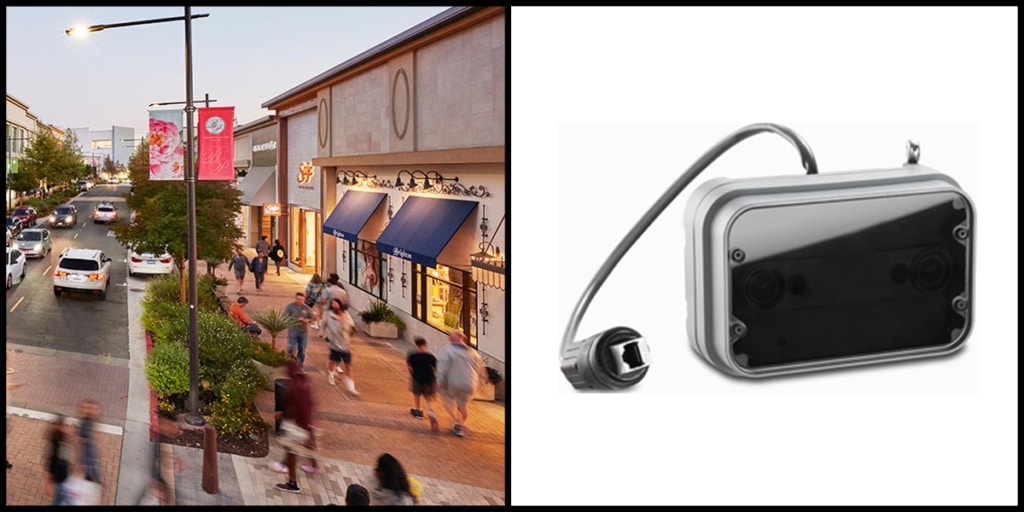
Outdoor-rated people counters collect data in the same way and with the same accuracy as their indoor counterparts. It’s resistant to all kinds of external influences, such as shadows, light changes and heat emission and includes an outdoor-rated, pre-mounted casing and cabling in compliance with IP 65. The VIDX outdoor people counter operates in temperatures within -13 to 104 degrees F with air humidity up to 80%. A single cable run is required for the PoE device, making it ideal for places like amusement parks, shopping centers, water parks, and recreational facilities where network infrastructure is in place, as opposed to remote locations such as deep within a forest or trail.
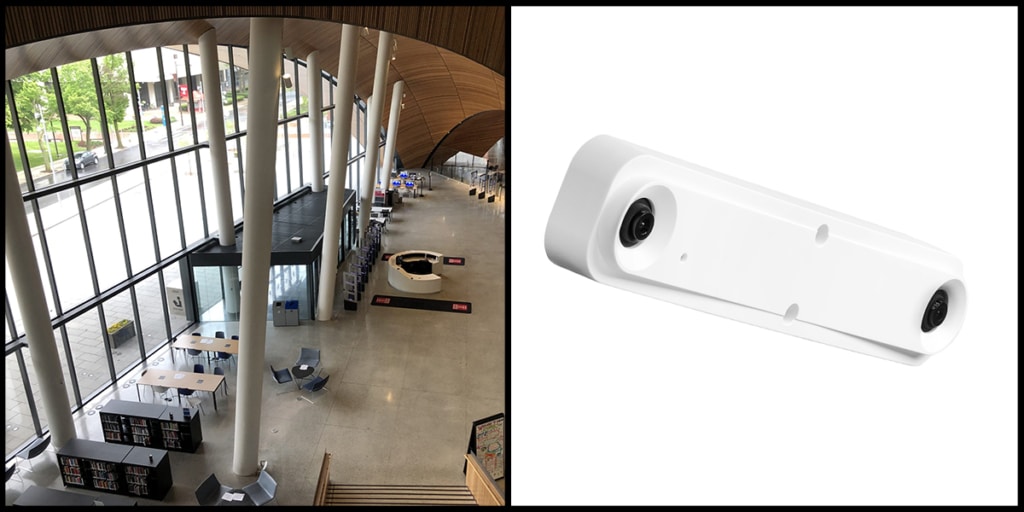
While the fleet of SenSource people counters function in the same way, each is unique in the width of its detection area and height at which it’s installed. A majority of applications fall within the parameters of our standard sensor with a mounting height of 7.5’ to 19’ and detection area up to 23’ x 16’. But for some historic buildings, museums, campus buildings, and outdoor venues, the parameters fall outside the normal range. In these instances, a sales rep will determine the most fitting sensor type. When the ceiling height is standard, but the width of the entrance is not, the VIDX-SL may be considered with the same installation height range as the VIDX but with a detection width up to 35’ x 26’. If the sensor is to be mounted higher than 19’ from the ground, such as in a historic library with a vast atrium or outside a concert venue, the VIDX3 may be considered as it can be installed at 19.5’ x 65’ with detection areas ranging from 17’ x 14’ to 38’ x 28’.
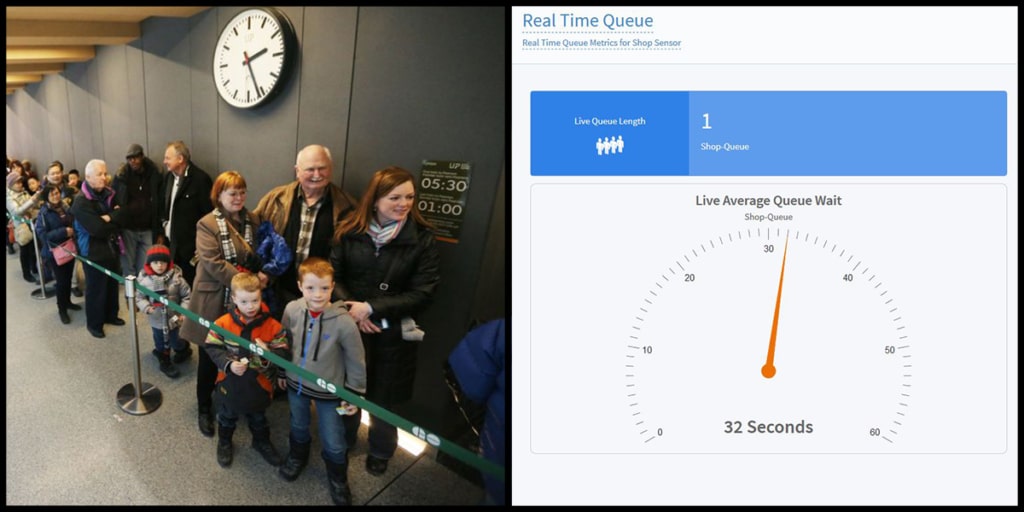
Waiting in a line and forming a queue are common scenes in many industries – from retail to amusement parks. By designating a queue zone on your people counter, you can collect data on how many people are in line and how long they’ve been waiting. Informed and timely decisions can then be made on when to dispatch personnel.
For grocery stores, SenSource offers a more complex version of queue monitoring that takes into account the rate customers are entering the store to predict when queues will form at check-out.
For amusement parks, SenSource offers an estimated ride wait time solution. It pairs sensors at the ride’s queue entrance and at the point where riders board. Calculations are performed in Vea Analytics for throughput and queue length to determine the estimated wait time for someone entering the queue. The estimated wait time can be displayed on a digital screen at the ride’s entrance.
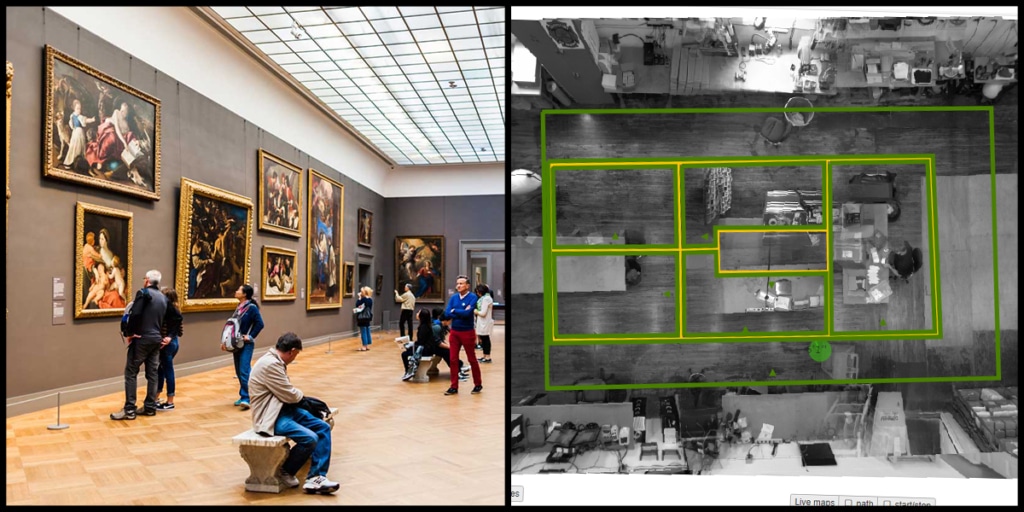
Museums, department stores, and other large venues need to know the hot spots of their facilities – the most popular exhibits, departments, or areas of the building. To map a large footprint, counting devices are installed on the ceiling above each area of interest. SenSource technical support will calibrate, virtually drawing count lines and zones on its view. The data output shows how many people entered the area of interest and the average dwell time. For example, on Tuesday of the 800 visitors to the museum, 625 viewed the ancient artifacts exhibit and spent an average of 6 minutes.
Armed with visitor journey data, floorplans can be revised to best highlight the hottest areas while encouraging a traffic flow that avoids bottlenecks. The data is also used to guide operational decisions such as allocating renovation funds, scheduling staff, and placing food and souvenir kiosks.
Learn more about SenSource’s people counting sensors