We’re being asked quite often these days to express the impact we’re having on our campus, how we’re impacting enrollment and engagement. Typically for a union student center that’s been a lot of qualitative data. We haven’t had a lot of hard numbers. But traffic data is something we can capture very accurately and use that to tell our stories.
Jeremiah Johnson Director of Hill Center at UAB
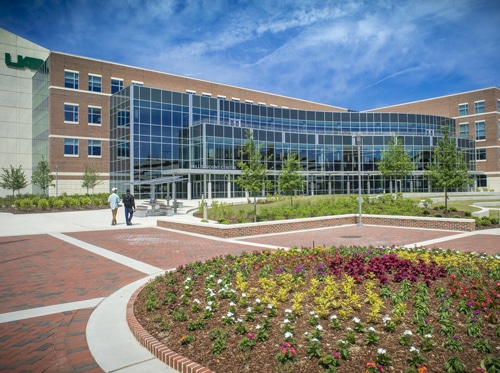
2018 Jeremiah Johnson became the Director of the Hill Student Center at the University of Alabama. He tuned-in to all the minute details that made the student center function, looking for areas in need of improvements for his overall goal of fostering a welcoming, supportive, and affirming community for all while also being committed to resource stewardship and ensuring administrative efficiency.
While walking and observing the student center, he began to notice certain peak times with heavy student traffic as well as low-times. However, the staff schedule for the center’s information desk was not a reflection of this fluctuation in student demand and workload.
These are by far some of the best people we have on campus, our students employed here at the student center, but they’re not cheap. So, I wanted to know, are we utilizing them appropriately?
Jeremiah Johnson Director of Hill Center at UAB
The typical staffing model was to have two students working the information desk during the student center’s open hours. 2 staff members x 45 hours open = 90 hours of staff time / approximately $650 per week. But Jeremiah didn’t want to base any changes on a hunch. He wanted data and historical trends to guide his decisions.
Jeremiah researched people counting companies and decided upon SenSource’s system. Knowing SenSource’s VIDX sensors collect foot traffic with 97% or greater accuracy, Jeremiah could confidently decide if staffing changes were needed.

12 sensors were installed across the student center’s entrances to collect foot traffic data of students coming and going throughout the building. Data was collected over an entire semester, six months, to ensure a complete depiction of traffic through high attendance events, slow periods, and average trafficked days.
Very quickly we started discovering a world of things that were different from our assumptions. For one, how many folks were visiting our facility on a daily, weekly, annual basis. It’s far more than we ever imagined, which is great and helps us advocate for those dollars because we’re impacting a lot of folks throughout the year.
Jeremiah Johnson Director of Hill Center at UAB
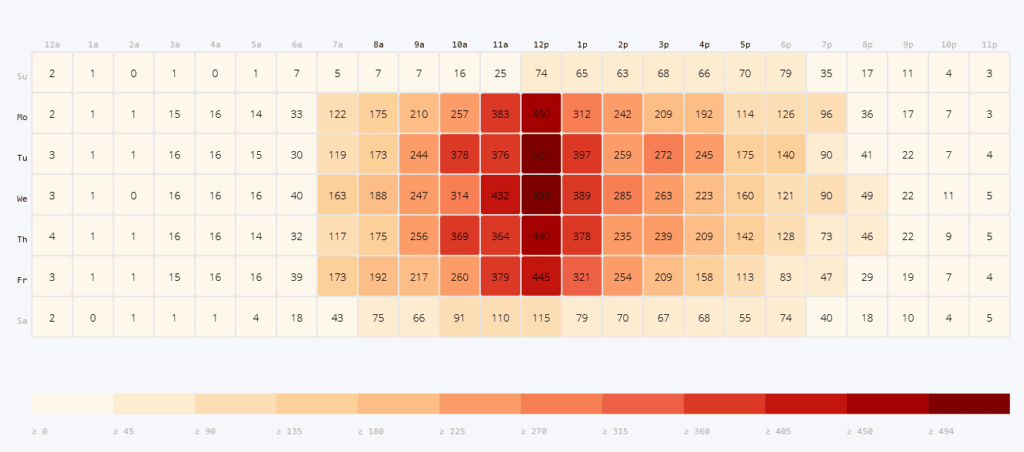
UAB Hill Center 2019 foot traffic pre-COVID

Jeremiah used SenSource’s Vea Reporting Platform to run reports and analyze the data. He collected his thoughts into a formal proposal in which he recommended reducing staff levels at the information desk during the identified non-peak times.
What you start to find very clearly is this sweet spot, our peak hours, which is what I was interested in. And for us the data clearly shows it’s basically 9 am to 4 pm most days of the week.
Jeremiah Johnson Director of Hill Center at UAB
By reducing staff levels to one student staff member at the information desk during the non-peak hours, would result in a financial savings of $222.50 per week – $11,000 per year!
With the data to support Jeremiah’s proposed staff changes, leadership accepted the proposal.
We could decrease our staff and save some money without worrying about decreasing our service because there just wasn’t enough engagement happening at the desk for two students.
Jeremiah Johnson Director of Hill Center at UAB
Not only did Jeremiah find the foot traffic data useful for staffing changes, he also regularly assesses the data to gauge impact and tell the center’s story, to adjust marketing placement, and to advocate for resources.


